import matplotlib.pyplot as plt
from zfish.plot.plot_commons import BASE, UMAP
from spatial_image import to_spatial_image
import numpy as np
from matplotlib.patches import Rectangle
from zfish.image.meta_accessor import ImageMetaAccessor  # noqa: F401


plt.style.use(BASE)
plt.rcParams['axes.unicode_minus'] = False

def plot_empty(img):
    img_nas = img.copy()
    img_nas.data = np.repeat(np.nan, img.size).reshape(img.shape)
    return img_nas.plot(add_colorbar=False)

def plot_grid(img):
    plt.scatter(*np.meshgrid(img.x, img.y), color='firebrick')

def _plot_xarray_grid(img):

    fig, ax = plt.subplots()
    plt.sca(ax)
    rec = Rectangle([e/2 for e in img.meta.scale[::-1]], *img.meta.scale[::-1], edgecolor='firebrick', fill=False)

    img.plot(add_colorbar=True)
    plot_grid(img)
    plt.scatter(x=[0], y=[0], marker="+", s=60, lw=0.5, c="0.7", zorder=80)
    ax = plt.gca()
    ax.set_aspect('equal')
    ax.set_yticks(img.y)
    ax.set_xticks(img.x)
    ax.set_xlim(img.x.min()-1, img.x.max()+1)
    ax.set_ylim(img.y.min()-1, img.y.max()+1)
    ax.set_aspect('equal')
    ax.add_artist(rec)
    return ax
In [79]:
In [80]:
import numpy as np
import xarray as xr
from spatial_image import to_spatial_image

xr.set_options(display_expand_data=False);
In [81]:
img = to_spatial_image(
    np.arange(6).reshape(3, 2, 1), # data values
    dims=['c', 'y', 'x'], # dimension names
    scale={'y': 0.0, 'x': 0.5}, # coordinate scales
    c_coords=['DAPI', 'PCNA', 'pH3'], # c coordinate
)
In [82]:
print(img)<xarray.DataArray 'image' (c: 3, y: 2, x: 1)> Size: 24B
0 1 2 3 4 5
Coordinates:
* c (c) <U4 48B 'DAPI' 'PCNA' 'pH3'
* y (y) float64 16B 0.0 0.0
* x (x) float64 8B 0.0In [83]:
print(img.sel(c='PCNA'))<xarray.DataArray 'image' (y: 2, x: 1)> Size: 8B
2 3
Coordinates:
c <U4 16B 'PCNA'
* y (y) float64 16B 0.0 0.0
* x (x) float64 8B 0.0In [84]:
print(img.squeeze())<xarray.DataArray 'image' (c: 3, y: 2)> Size: 24B
0 1 2 3 4 5
Coordinates:
* c (c) <U4 48B 'DAPI' 'PCNA' 'pH3'
* y (y) float64 16B 0.0 0.0
x float64 8B 0.0In [85]:
print(img.squeeze().expand_dims('x'))<xarray.DataArray 'image' (x: 1, c: 3, y: 2)> Size: 24B
0 1 2 3 4 5
Coordinates:
* c (c) <U4 48B 'DAPI' 'PCNA' 'pH3'
* y (y) float64 16B 0.0 0.0
* x (x) float64 8B 0.0In [86]:
# Create a spatial image
cyx_img = to_spatial_image(
    array_like=np.arange(36).reshape(2, 3, 6),
    dims=["c", "y", "x"],
    scale={'x': 0.5, 'y': 1.0},
    c_coords=["DAPI", "pH3"],
    axis_units={"x": "μm", "y": "μm"},
    name="val [AU]",
)

# # select a channel by name
yx_img = cyx_img.sel(c="DAPI")
In [87]:
import io

def save_ax_nosave(ax, **kwargs):
    ax.axis("off")
    ax.figure.canvas.draw()
    trans = ax.figure.dpi_scale_trans.inverted()
    bbox = ax.bbox.transformed(trans)
    buff = io.BytesIO()
    plt.savefig(buff, format="png", dpi=ax.figure.dpi, bbox_inches=bbox,  **kwargs)
    ax.axis("on")
    buff.seek(0)
    im = plt.imread(buff )
    return im
In [92]:
[e for e in plt.rcParams.keys() if 'dpi' in e]['figure.dpi', 'savefig.dpi']In [93]:
Code
scale = 1.5

params = {
    "figure.figsize": (1.8, 1.6),
    "axes.labelsize": 5,
    "axes.titlesize": 6,
    "xtick.labelsize": 5,
    "ytick.labelsize": 5,
    "legend.fontsize": 5,
    "legend.title_fontsize": 5,
    "lines.markersize": 3,
    "lines.linewidth": 1,
}

params_scaled = {}

for k, v in params.items():
    if isinstance(v, (int, float)):
        params_scaled[k] = v * scale
    else:
        params_scaled[k] = tuple(e * scale for e in v)

# fig, ax = plt.subplots(figsize=(3.6, 3.2))

with plt.style.context({**params_scaled, 'figure.dpi': 500}):
    ax = _plot_xarray_grid(yx_img)
    # ax.figure.set_size_inches(2.85, 2.4)
# ax.imshow(save_ax_nosave(ax))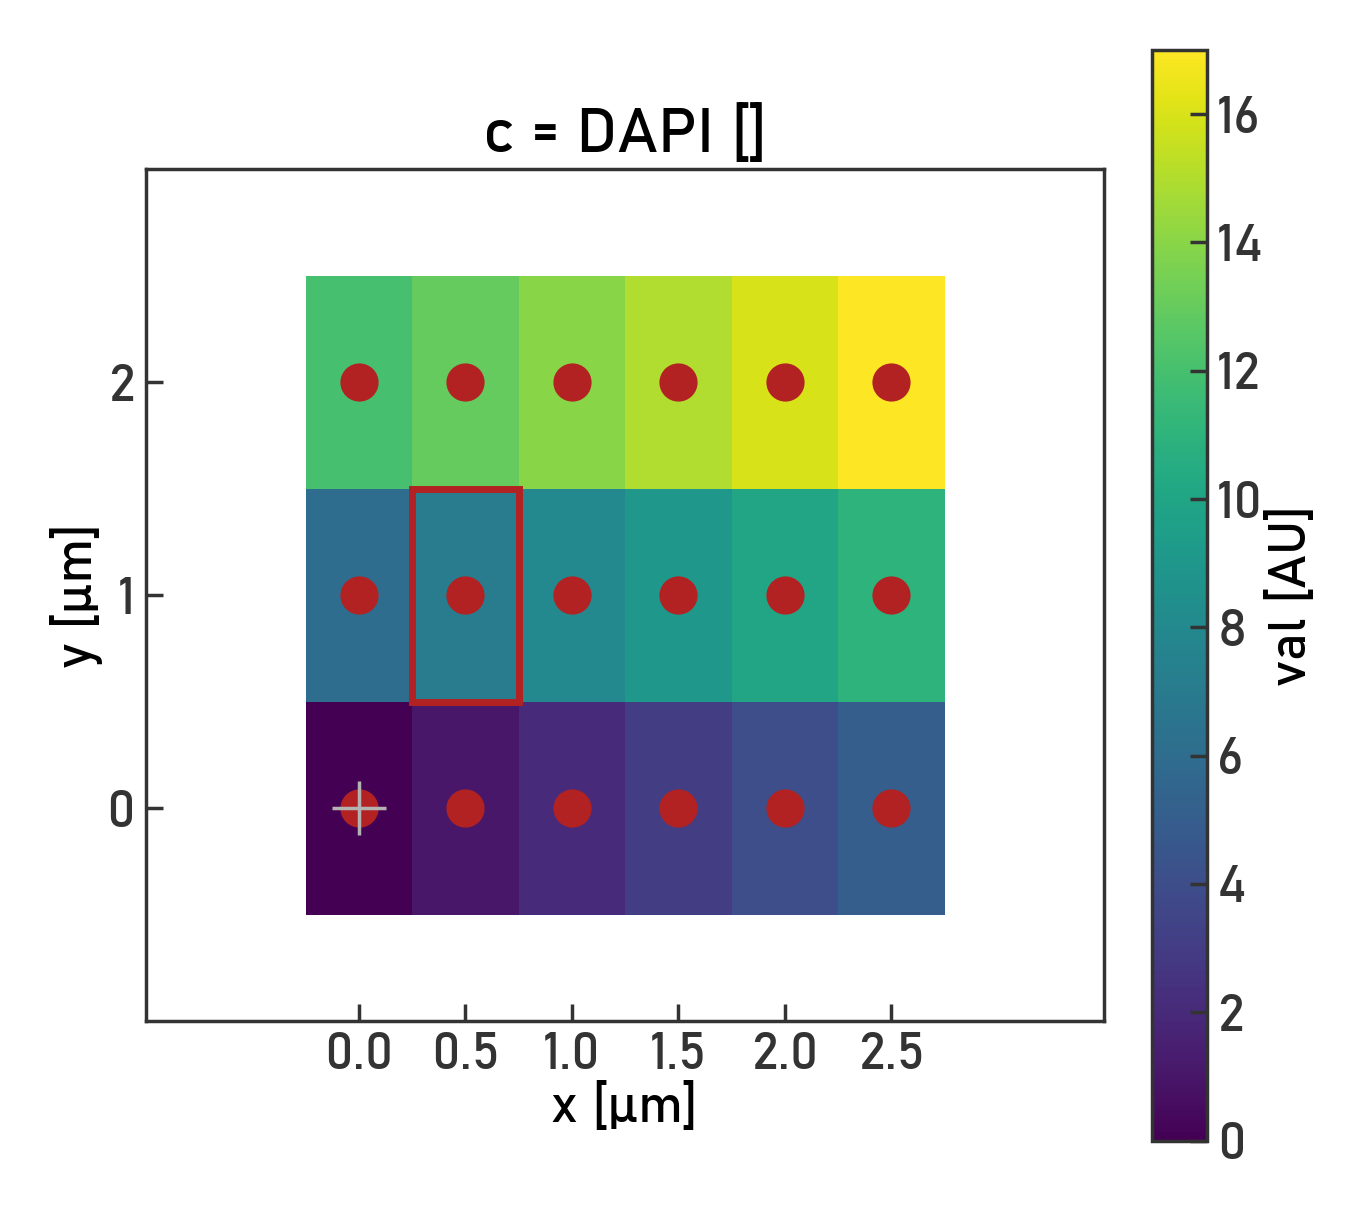
In [29]:
Code
from skimage.data import binary_blobs
from skimage.measure import label
import matplotlib.pyplot as plt
import cmap
import numpy as np
from spatial_image import to_spatial_image


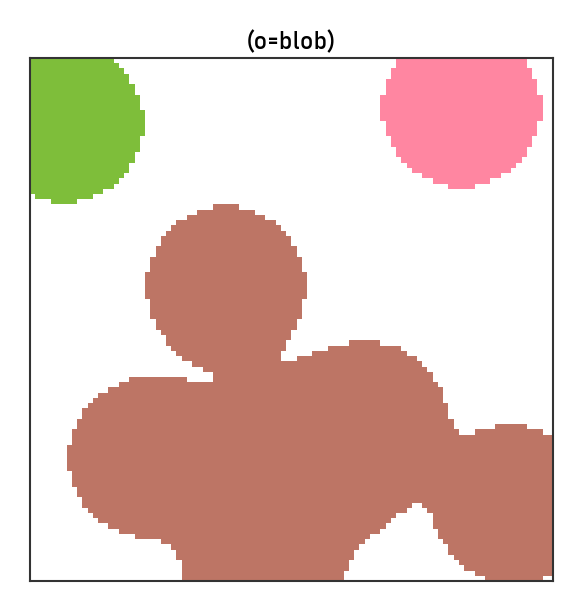
lbl_img = label(binary_blobs(100, blob_size_fraction=0.3, rng=42))

with plt.style.context(UMAP):
    fig, ax = plt.subplots(figsize=(2,2))
    plt.imshow(lbl_img, cmap=cmap.Colormap('glasbey').to_mpl())
    cmap.Colormap('glasbey')(3)
    plt.title(f'(o=blob)')
In [30]:
Code
plt.ion()
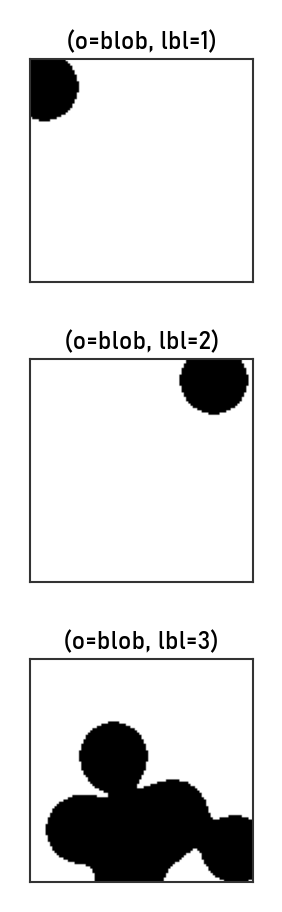
fig, axs = plt.subplots(3, 1, figsize=(9, 3))
masks = [lbl_img==lbl for lbl in np.unique(lbl_img)[1:]]

# with plt.rc_context(fname=UMAP, {'axes.grid':False}):
for i, (mask, ax) in enumerate(zip(masks, axs.flatten()), 1):
    plt.sca(ax)
    plt.imshow(mask, cmap='gray_r')
    plt.xticks([])
    plt.yticks([])
    plt.title(f"(o=blob, lbl={i})")

# plt.style.available
# UMAP